How to create charts in bokeh with flask
Bokeh is an interactive visualization library for modern web browsers. It provides elegant, concise construction of versatile graphics, and affords high-performance interactivity over large or streaming dataset. Below are steps for creating charts with Bokeh and Flask.
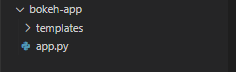
Directory structure should be as shown below.
Write below code in app.py
Run the app.py and browser should display below response.
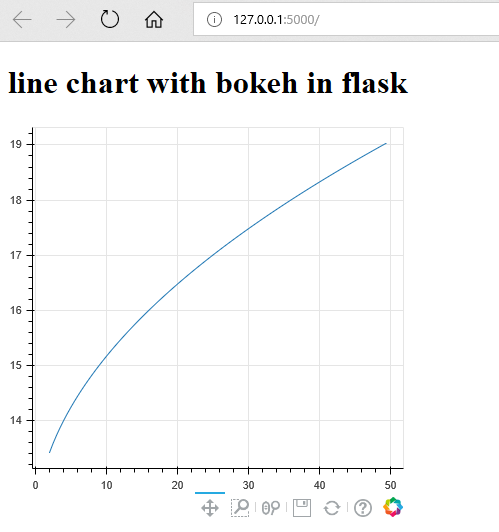
If browser does not display charts than check bokeh version and cdn links used in html for css and js. Use cdn urls compatible with the bokeh version.
Category: Python