How to create scatter plot with Bokeh
Bokeh is an interactive visualization library for modern web browsers. It provides elegant, concise construction of versatile graphics, and affords high-performance interactivity over large or streaming dataset.
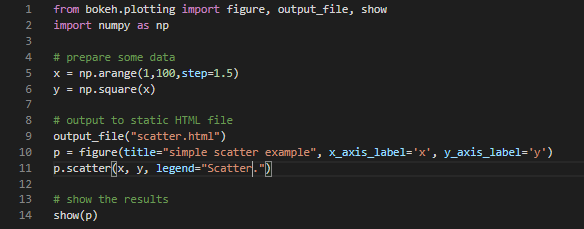
Complete code for creating the scatter plot with Bokeh

Category: Python