Kubernetes POD monitoring with Prometheus and Grafana
Prometheus Operator simplify and automates the configuration of a Prometheus based monitoring stack for Kubernetes clusters. This tutorial explains how to install Prometheus Operator with helm package manager.
Pre-requisite : Below are the some pre-requisite for following this tutorial.
- GKE cluster with at least 3 nodes
- helm set up for GKE cluster
Refer How to set up Helm for Kubernetes Cluster in case you don't have set up ready.
Steps for configuring Prometheus and Grafana for POD monitoring
Login to Google Cloud Console
Activate Cloud Shell  to open Cloud Shell.
Install prometheus-operator chart with helm
~/helm install --name test-release stable/prometheus-operator --set grafana.enabled=true
Run kubectl command to check service names.
kubectl get svc
Change grafana service from type: ClusterIP to type:LoadBalancer, for this run below command,
it will open configuration in Vi editor, update the entry corresponding to type: ClusterIP to type:LoadBalancer
and save changes.
kubectl edit -n default service/test-release-grafana
Run kubectl get svc command and check for external IP for test-release-grafana service.
Assigning external IP may take some time, run kubectl get svc multiple times to get external ip.
******@cloudshell:~ (****-api)$ kubectl get svc
NAME                                      TYPE           CLUSTER-IP    EXTERNAL-IP      PORT(S)                      AGE
alertmanager-operated                     ClusterIP      None                     9093/TCP,9094/TCP,9094/UDP   14m
kubernetes                                ClusterIP      10.*.*.*                 443/TCP                      3h7m
prometheus-operated                       ClusterIP      None                     9090/TCP                     13m
test-release-grafana                      LoadBalancer   10.*.*.*     35.##.###.##   80:31864/TCP                 14m
test-release-kube-state-metrics           ClusterIP      10.*.*.*                8080/TCP                     14m
test-release-prometheus-node-exporter     ClusterIP      10.*.*.*              9100/TCP                     14m
test-release-prometheus-op-alertmanager   ClusterIP      10.*.*.*               9093/TCP                     14m
test-release-prometheus-op-operator       ClusterIP      10.*.*.*             8080/TCP,443/TCP             14m
test-release-prometheus-op-prometheus     ClusterIP      10.*.*.*               9090/TCP                     14m
Note down external IP assigned to test-release-grafana and enter external ip in browser, you should see Grafana login page.

Login with below details in Grafana
- Username : admin
- Password: prom-operator
Click on Home Button in Grafana

After clicking on home you should see many pre configured dashboard for Kubernetes monitoring
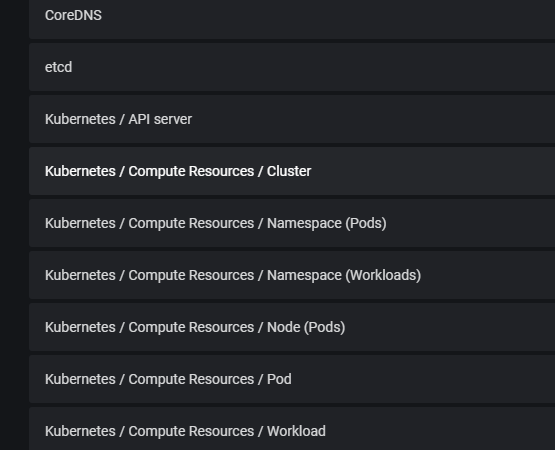
Click on any dashboard to check Cluster/POD monitoring information.
Note:If you are facing any issue issue with this set up, post the error in comment section, we will try to help you on that.
Category: GCP